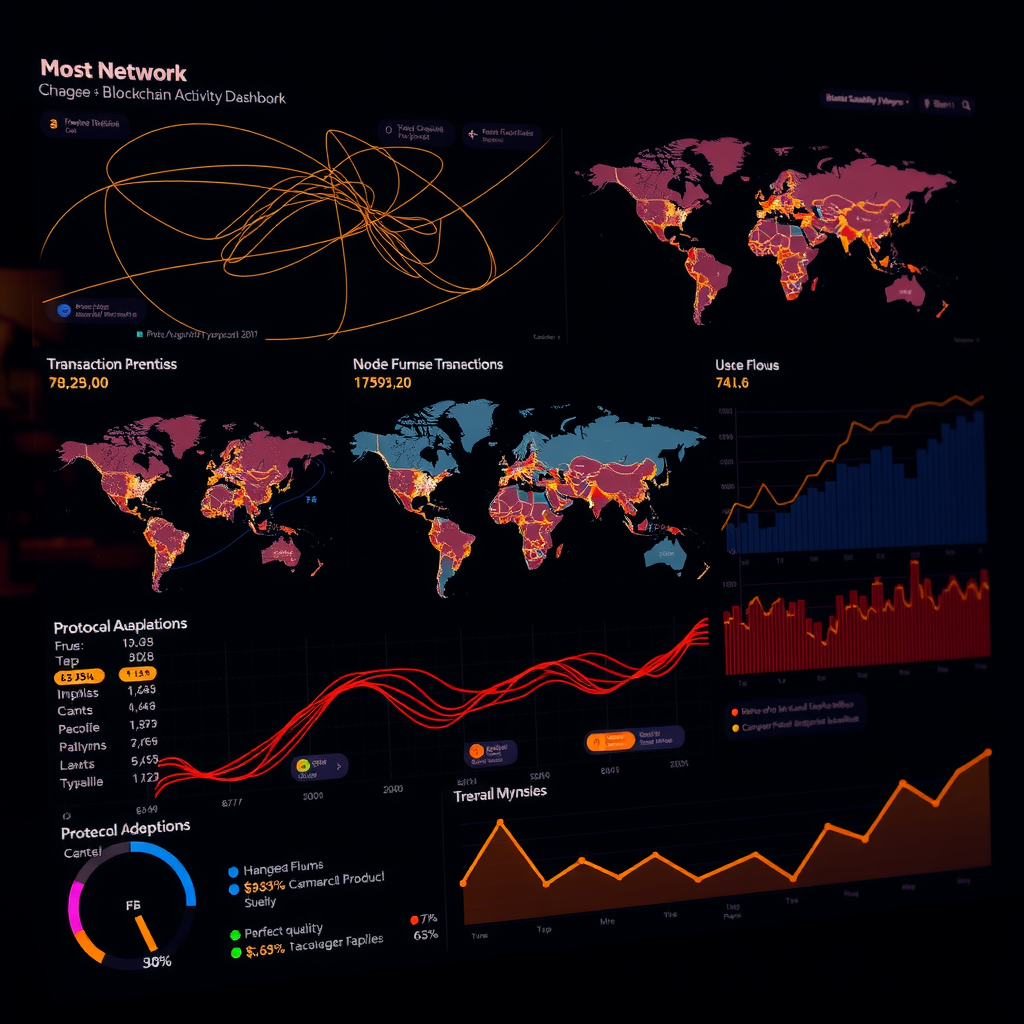
Network Activity Analysis: Identifying Trends in Blockchain Ecosystems
Understanding network activity patterns is fundamental to extracting meaningful insights from blockchain ecosystems. This comprehensive guide explores analytical methodologies, statistical approaches, and practical tools that enable researchers and analysts to track ecosystem growth, decode user behavior, and measure protocol adoption across decentralized networks.
The Foundation of Network Activity Analysis
Network activity analysis represents the systematic examination of on-chain data to identify patterns, trends, and anomalies within blockchain ecosystems. Unlike traditional data analysis, blockchain networks provide unprecedented transparency, allowing analysts to observe every transaction, smart contract interaction, and state change in real-time. This transparency creates unique opportunities for understanding ecosystem dynamics at a granular level.
The challenge lies not in data availability but in processing vast amounts of information to extract actionable insights. Modern blockchain networks generate millions of transactions daily, each containing multiple data points that contribute to the overall network narrative. Effective analysis requires robust methodologies that can handle this scale while maintaining analytical precision.
Key Insight
Successful network analysis combines quantitative metrics with qualitative context. Raw transaction counts tell only part of the story—understanding the why behind network activity patterns requires examining economic incentives, protocol changes, and external market factors that influence user behavior.
Core Metrics for Network Activity Tracking
Establishing a comprehensive metrics framework forms the foundation of effective network analysis. These metrics serve as quantifiable indicators of network health, growth trajectories, and user engagement patterns.
Transaction Volume and Velocity
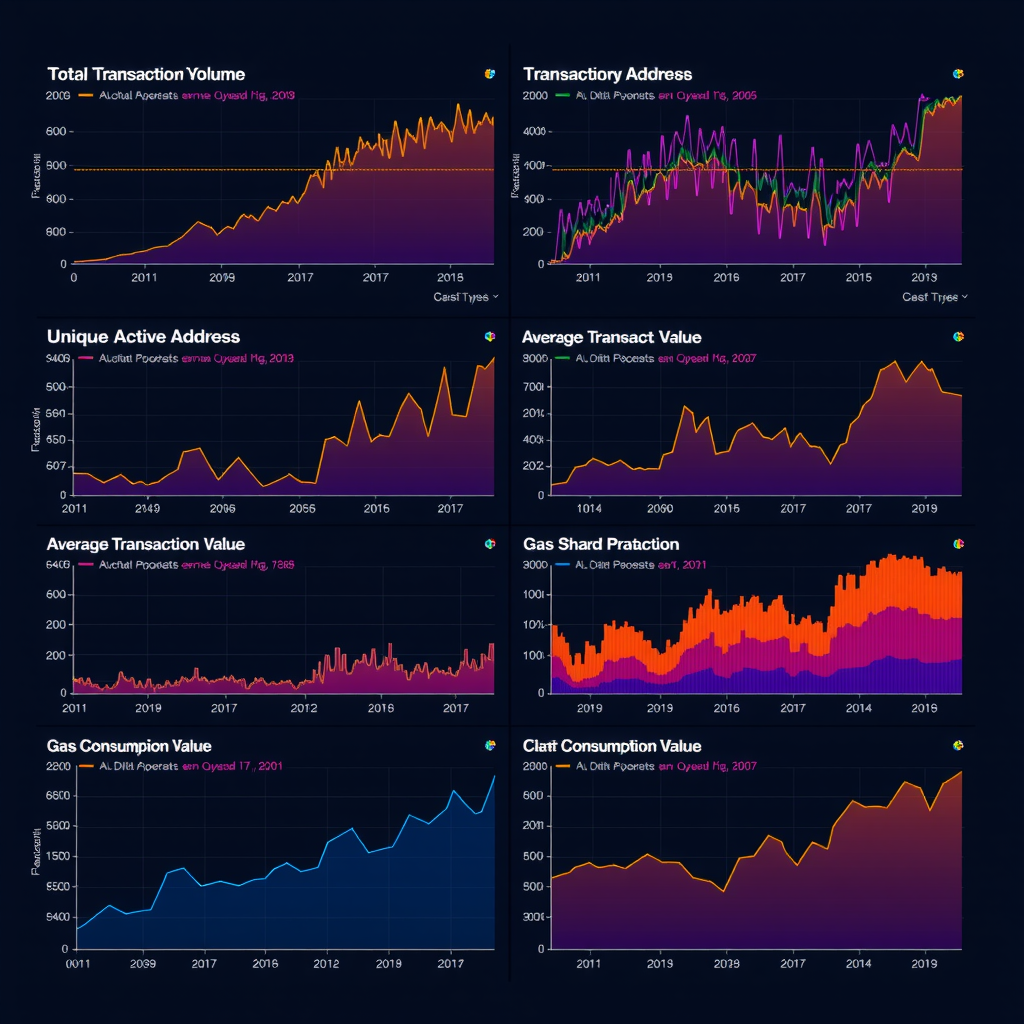
Transaction volume represents the total number of transactions processed within a specific timeframe, while velocity measures the rate at which transactions occur. These fundamental metrics provide immediate insight into network utilization and demand. However, raw transaction counts can be misleading—networks with low fees may exhibit artificially inflated volumes due to spam or automated activity.
Advanced analysis distinguishes between organic and synthetic activity by examining transaction patterns, value transfers, and gas consumption. Legitimate economic activity typically exhibits distinct patterns: varied transaction amounts, consistent gas price behavior, and logical interaction sequences with smart contracts. Automated or spam transactions often show repetitive patterns, minimal value transfers, and unusual timing distributions.
Active Address Metrics
Active addresses measure the number of unique addresses participating in network activity during a given period. This metric serves as a proxy for user adoption and engagement, though it requires careful interpretation. A single user may control multiple addresses, while a single address might represent an exchange serving thousands of users.
Daily Active Addresses (DAA) and Monthly Active Addresses (MAA) provide different perspectives on network engagement. DAA captures short-term activity fluctuations and responds quickly to events, while MAA smooths volatility and reveals longer-term adoption trends. Comparing these metrics helps identify whether growth is sustained or driven by temporary events.
Network Value Transfer
The total value transferred across a network indicates economic activity magnitude. This metric encompasses both native token transfers and value moved through smart contracts, including decentralized exchange swaps, lending protocols, and NFT marketplaces. Analyzing value transfer patterns reveals which applications drive economic activity and how value flows through the ecosystem.
Segmenting value transfers by size categories provides additional insights. Large transfers often represent institutional activity, exchange movements, or whale transactions, while smaller transfers indicate retail participation and everyday usage. The distribution between these categories reflects network maturity and user base composition.
Analytical Methodologies for Trend Identification
Identifying meaningful trends requires applying statistical and analytical techniques that separate signal from noise in blockchain data. These methodologies transform raw metrics into actionable intelligence.
Time Series Analysis
Time series analysis examines how metrics evolve over time, revealing patterns, cycles, and trends. Moving averages smooth short-term volatility to expose underlying trends—7-day and 30-day moving averages are particularly useful for blockchain metrics. When short-term averages cross above long-term averages, it often signals emerging upward trends, while the reverse indicates potential downturns.
Seasonal decomposition separates time series data into trend, seasonal, and residual components. Blockchain networks often exhibit weekly patterns (reduced weekend activity) and monthly cycles (correlated with token unlock schedules or protocol governance cycles). Identifying these patterns enables analysts to distinguish between cyclical fluctuations and genuine trend changes.
Statistical Approach
Exponential smoothing techniques assign greater weight to recent observations while maintaining historical context. This approach proves particularly valuable for blockchain metrics where recent activity often predicts near-term trends more accurately than distant historical data.
Smoothed_Value(t) = α × Actual_Value(t) + (1-α) × Smoothed_Value(t-1)
Cohort Analysis
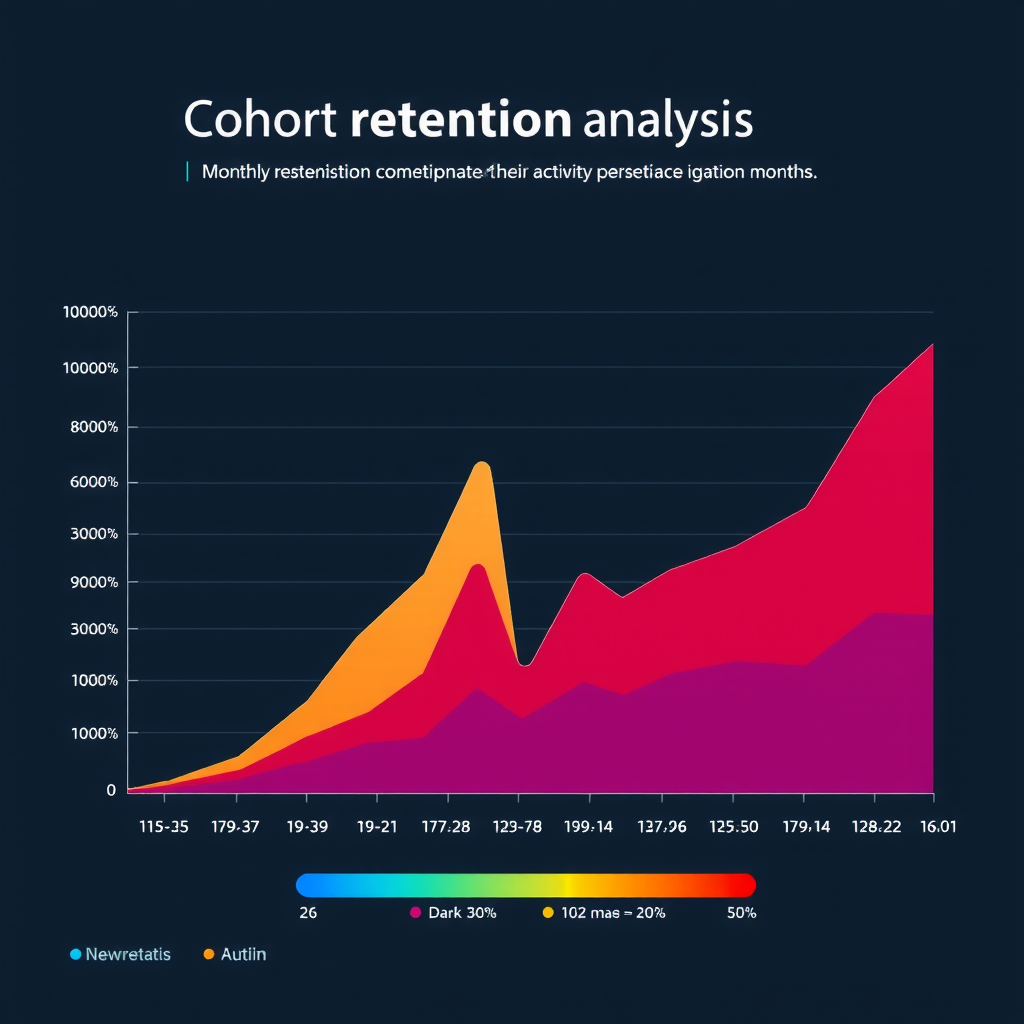
Cohort analysis groups addresses by their first interaction date and tracks their subsequent behavior over time. This methodology reveals retention patterns, user lifecycle stages, and the long-term value of different user cohorts. Networks with strong retention show cohorts maintaining activity levels months after initial engagement, while declining retention suggests user experience or value proposition issues.
Analyzing cohorts by acquisition source (airdrop recipients, early adopters, recent users) provides insights into which growth strategies produce the most engaged users. This information guides resource allocation for user acquisition and retention initiatives.
Network Graph Analysis
Blockchain transactions create natural network graphs where addresses are nodes and transactions are edges. Graph analysis techniques reveal network structure, identify influential addresses, and detect community formation. Centrality metrics quantify address importance—high-degree centrality indicates addresses with many connections, while betweenness centrality identifies addresses that bridge different network communities.
Community detection algorithms identify clusters of addresses that interact frequently with each other. These communities often represent distinct user groups, application ecosystems, or coordinated activities. Tracking community evolution reveals how the network organizes itself and whether new communities emerge as the ecosystem matures.
Protocol Adoption Measurement
Understanding protocol adoption requires examining how users interact with smart contracts and decentralized applications. This analysis extends beyond simple transaction counts to evaluate engagement depth, feature utilization, and value locked in protocols.
Smart Contract Interaction Patterns
Analyzing smart contract calls reveals which protocols attract user attention and how users engage with different features. Function call frequency indicates feature popularity, while the sequence of calls shows user workflows and common interaction patterns. Protocols with diverse function usage demonstrate healthy adoption across their feature set, while concentration in a few functions might indicate limited utility or user awareness.
Gas consumption patterns provide additional insights into protocol complexity and efficiency. Protocols that optimize gas usage while maintaining functionality often achieve broader adoption, as users prefer cost-effective interactions. Tracking gas consumption trends over time reveals whether protocol upgrades improve efficiency or introduce overhead.
Total Value Locked (TVL) Dynamics
TVL measures the total value of assets deposited in DeFi protocols, serving as a key indicator of protocol trust and utility. However, TVL alone doesn't tell the complete story—analyzing TVL composition, concentration, and stability provides deeper insights. Protocols with diversified TVL across many users demonstrate broader trust than those dominated by a few large depositors.
TVL velocity—the rate at which value enters and exits protocols—indicates capital efficiency and user behavior. High velocity suggests active trading and yield farming, while stable TVL indicates long-term commitment. Comparing TVL changes with token price movements reveals whether growth is organic or driven by speculative incentives.
Best Practice
When analyzing protocol adoption, normalize metrics by network size and market conditions. A protocol gaining 1,000 users during a bear market demonstrates stronger product-market fit than one gaining 10,000 users during a speculative bull run. Context-aware analysis produces more reliable insights.
Practical Tools and Data Sources
Effective network analysis requires robust tools and reliable data sources. The blockchain analytics ecosystem offers various solutions, from comprehensive platforms to specialized tools for specific analysis types.
Blockchain Explorers and Analytics Platforms
Block explorers provide foundational access to on-chain data, enabling transaction lookup, address monitoring, and smart contract verification. Advanced explorers like XRCScan offer analytical features including transaction visualization, address labeling, and historical data queries. These platforms serve as starting points for investigation and provide context for deeper analysis.
Specialized analytics platforms aggregate data across multiple sources, providing pre-calculated metrics and visualization tools. These platforms handle data processing complexity, allowing analysts to focus on interpretation rather than infrastructure. However, understanding underlying data collection and calculation methodologies remains crucial for accurate analysis.
Data APIs and Query Languages
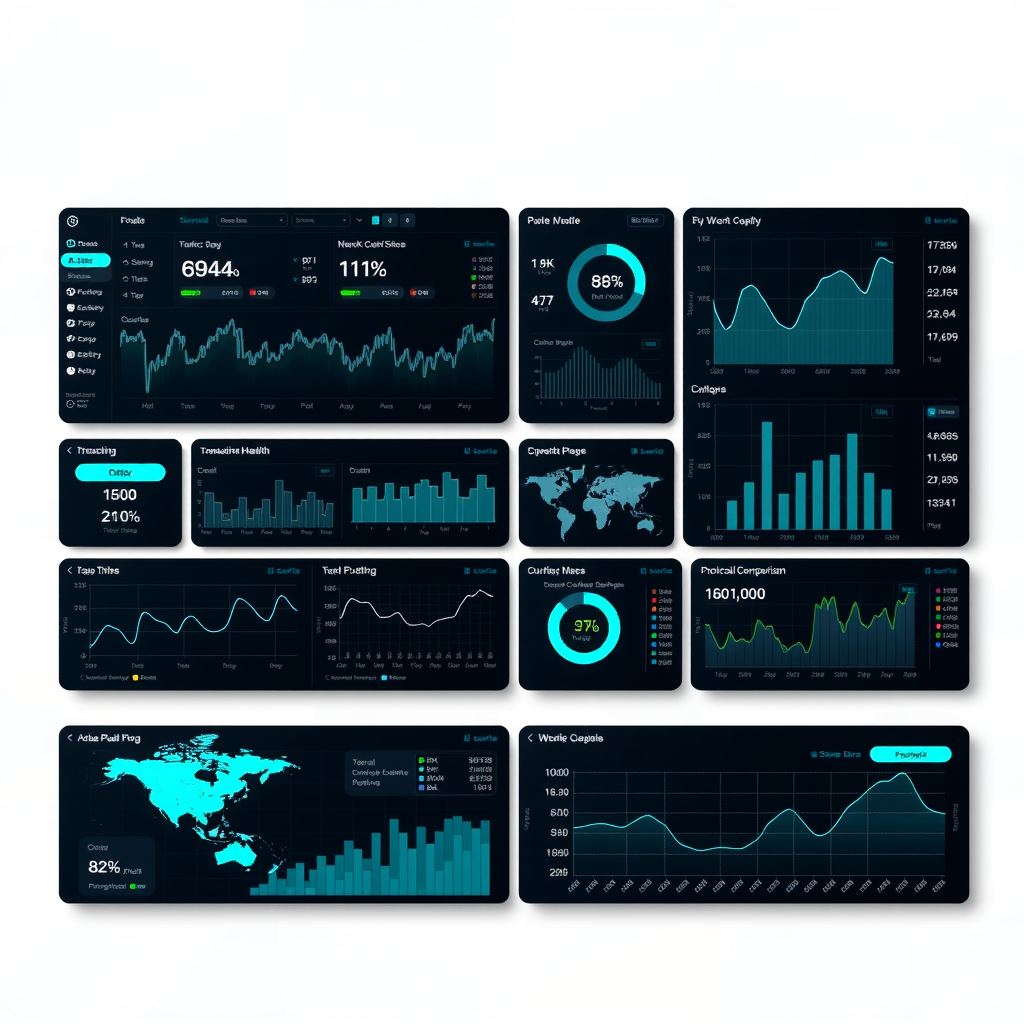
APIs provide programmatic access to blockchain data, enabling custom analysis and automated monitoring. RESTful APIs offer straightforward integration for common queries, while GraphQL APIs provide flexible data retrieval with precise field selection. Choosing the appropriate API depends on analysis requirements, data volume, and update frequency needs.
SQL-based query interfaces like Dune Analytics democratize blockchain analysis by allowing analysts to write custom queries against indexed blockchain data. These platforms handle infrastructure complexity while providing the flexibility of SQL for complex analytical queries. The ability to share and fork queries creates a collaborative analysis environment where insights build upon previous work.
Custom Data Pipelines
For specialized analysis requirements, building custom data pipelines provides maximum flexibility and control. These pipelines typically involve running blockchain nodes for direct data access, indexing relevant data into databases, and implementing custom processing logic. While resource-intensive, custom pipelines enable proprietary analysis methodologies and real-time monitoring capabilities unavailable through third-party platforms.
Modern data pipeline architectures leverage streaming technologies to process blockchain data in real-time, enabling immediate trend detection and automated alerting. Combining historical analysis with real-time monitoring creates comprehensive analytical capabilities that support both strategic planning and tactical decision-making.
Advanced Analytical Techniques
As blockchain ecosystems mature, analytical techniques evolve to address increasingly complex questions about network behavior, user psychology, and ecosystem dynamics.
Machine Learning Applications
Machine learning models identify patterns in blockchain data that escape traditional statistical analysis. Classification algorithms categorize addresses by behavior type (trader, holder, bot, exchange), while clustering algorithms discover natural groupings in transaction patterns. These models learn from historical data to predict future behavior and detect anomalies.
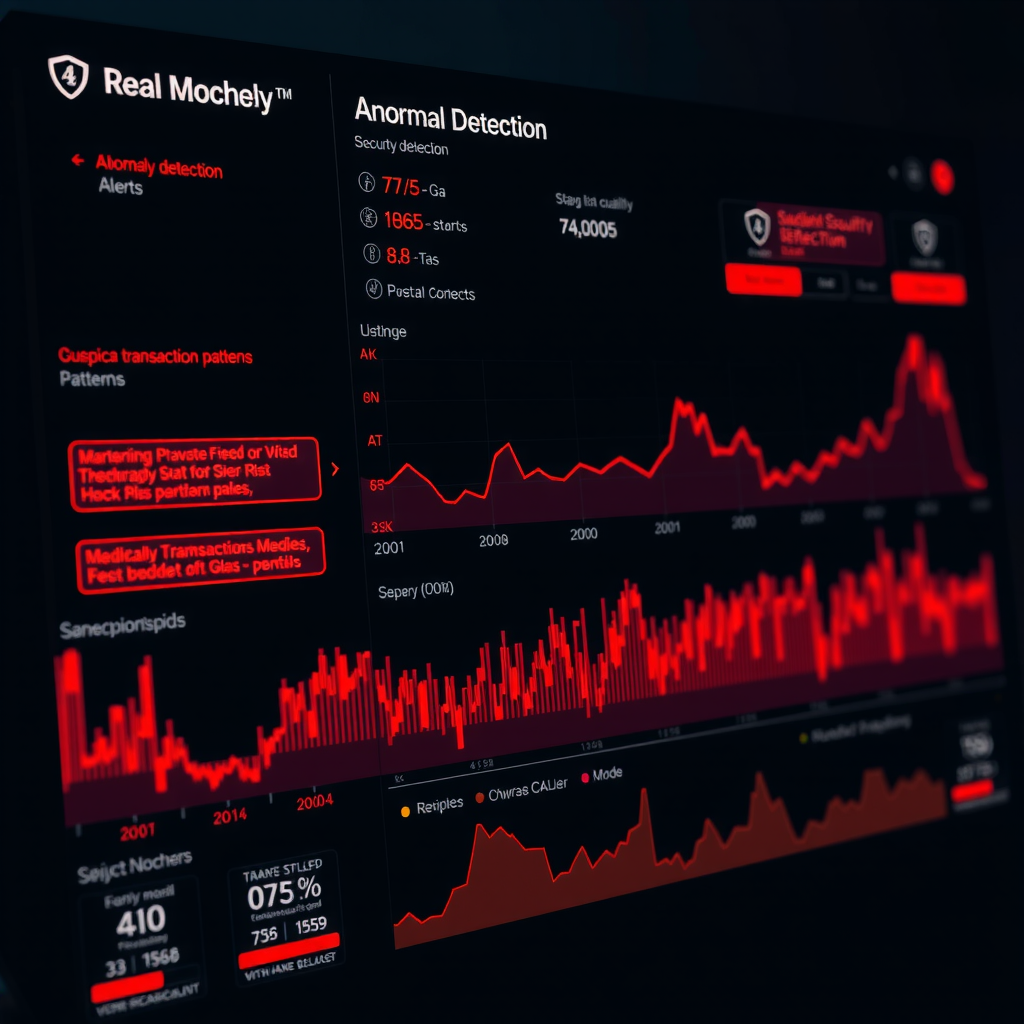
Anomaly detection models identify unusual network activity that might indicate security issues, market manipulation, or emerging trends. These models establish baseline behavior patterns and flag deviations that warrant investigation. Early detection of anomalies enables rapid response to threats and opportunities.
Cross-Chain Analysis
Multi-chain ecosystems require analytical approaches that track activity across multiple blockchains. Cross-chain analysis reveals how users distribute activity across networks, which chains capture specific use cases, and how value flows between ecosystems. Bridge transaction analysis provides insights into capital migration patterns and cross-chain arbitrage opportunities.
Comparing metrics across chains reveals competitive dynamics and relative strengths. Networks with similar features but different adoption patterns offer natural experiments for understanding what drives user choice. These comparisons inform strategic decisions about where to deploy resources and which features resonate with users.
Important Consideration
Cross-chain analysis faces challenges from inconsistent data formats, varying block times, and different economic models. Normalizing metrics across chains requires careful consideration of these differences to ensure valid comparisons. Always document normalization methodologies and their limitations.
Interpreting Results and Avoiding Common Pitfalls
Extracting accurate insights from network analysis requires careful interpretation and awareness of common analytical pitfalls that can lead to incorrect conclusions.
Correlation vs. Causation
Blockchain data often reveals strong correlations between metrics, but correlation doesn't imply causation. Increased transaction volume might correlate with rising token prices, but determining whether volume drives prices or prices drive volume requires additional analysis. Establishing causal relationships demands controlled experiments, natural experiments, or sophisticated statistical techniques like Granger causality tests.
External factors frequently influence multiple metrics simultaneously, creating spurious correlations. Market sentiment, regulatory news, and macroeconomic conditions affect various network metrics in parallel. Comprehensive analysis considers these external factors and their potential impact on observed patterns.
Survivorship Bias
Analyzing only successful protocols or active addresses introduces survivorship bias, where conclusions reflect survivors' characteristics rather than factors determining success. Failed protocols and inactive addresses provide equally valuable insights into what doesn't work. Comprehensive analysis includes both successes and failures to understand the full spectrum of outcomes.
Historical analysis faces similar challenges—networks that survived to present day may have characteristics that weren't predictive of success but rather resulted from luck or timing. Comparing current successful networks with historical failures provides more balanced perspectives on success factors.
Data Quality and Completeness
Blockchain data, while transparent, isn't always complete or accurate for analytical purposes. Address labeling remains incomplete, with many addresses lacking clear identification. Transaction purposes often require inference from patterns rather than explicit labels. Smart contract interactions may have unclear semantics without deep protocol knowledge.
Data quality issues compound in cross-chain analysis where different chains have varying data availability and indexing quality. Always validate data sources, understand their limitations, and document assumptions made when filling data gaps. Sensitivity analysis reveals how conclusions change under different assumptions about missing or uncertain data.
Practical Applications and Use Cases
Network activity analysis serves diverse stakeholders across the blockchain ecosystem, each with specific analytical needs and decision-making contexts.
Protocol Development and Optimization
Development teams use network analysis to understand how users interact with their protocols, identify pain points, and prioritize feature development. Usage patterns reveal which features drive engagement and which remain underutilized. Gas consumption analysis guides optimization efforts, focusing resources on frequently-used, expensive operations.
A/B testing on-chain enables data-driven protocol improvements. By deploying alternative implementations and comparing adoption rates, teams validate design decisions with real user behavior rather than assumptions. This empirical approach reduces development risk and accelerates product-market fit achievement.
Investment Research and Due Diligence
Investors leverage network analysis to evaluate protocol fundamentals and identify investment opportunities. Growing active user bases, increasing transaction volumes, and rising TVL indicate healthy protocols with strong product-market fit. Conversely, declining metrics or concerning patterns like high user churn signal potential issues.
Comparative analysis across similar protocols reveals competitive positioning and market share dynamics. Protocols gaining market share in growing categories represent particularly attractive opportunities, while those losing share in declining categories face compounding challenges. Network analysis provides objective data to complement qualitative assessments.
Security and Risk Management
Security teams monitor network activity for suspicious patterns indicating attacks, exploits, or market manipulation. Unusual transaction patterns, abnormal gas consumption, or unexpected smart contract interactions trigger investigations. Real-time monitoring enables rapid response to security incidents, minimizing potential damage.
Risk management applications include monitoring protocol concentration risk (TVL dominated by few addresses), tracking smart contract upgrade patterns, and analyzing governance participation. These analyses inform risk models and help stakeholders make informed decisions about protocol exposure.
Future Directions in Network Analysis
The field of blockchain network analysis continues evolving as ecosystems mature and analytical techniques advance. Several emerging trends promise to enhance analytical capabilities and unlock new insights.
Privacy-Preserving Analytics
As privacy-focused blockchains and protocols gain adoption, analytical techniques must adapt to extract insights from encrypted or obfuscated data. Zero-knowledge proofs enable verifiable analytics without revealing underlying data, while secure multi-party computation allows collaborative analysis across organizations without sharing raw data. These techniques balance transparency benefits with privacy requirements.
Real-Time Predictive Analytics
Combining historical analysis with real-time data streams enables predictive analytics that forecast network trends before they fully materialize. Machine learning models trained on historical patterns identify early indicators of trend changes, enabling proactive rather than reactive decision-making. These capabilities prove particularly valuable for trading strategies, risk management, and protocol optimization.
Standardization and Interoperability
The blockchain analytics ecosystem benefits from emerging standards for data formats, metric definitions, and analytical methodologies. Standardization enables easier comparison across chains, reduces analytical errors from inconsistent definitions, and facilitates collaboration across organizations. Industry initiatives working toward these standards promise to accelerate analytical capabilities across the ecosystem.
Conclusion
Network activity analysis transforms raw blockchain data into actionable intelligence, enabling stakeholders to understand ecosystem dynamics, identify trends, and make informed decisions. Success requires combining robust analytical methodologies with domain expertise, critical thinking, and awareness of analytical limitations.
As blockchain ecosystems continue evolving, analytical techniques must advance in parallel. The transparency inherent in blockchain technology creates unprecedented opportunities for data-driven decision-making, but realizing this potential demands sophisticated analytical approaches that extract signal from noise and context from data.
Whether optimizing protocols, evaluating investments, or ensuring security, effective network analysis provides the foundation for understanding blockchain ecosystems. By mastering the methodologies, tools, and interpretive frameworks outlined in this guide, analysts can unlock the full potential of blockchain data and contribute to ecosystem growth and maturation.
Key Takeaways
- Effective network analysis combines quantitative metrics with qualitative context to extract meaningful insights from blockchain data
- Core metrics including transaction volume, active addresses, and value transfer provide foundational understanding of network health and growth
- Advanced analytical techniques like time series analysis, cohort analysis, and network graph analysis reveal deeper patterns and trends
- Protocol adoption measurement requires examining smart contract interactions, TVL dynamics, and user engagement depth
- Robust tools and data sources, from blockchain explorers to custom pipelines, enable comprehensive analytical capabilities
- Careful interpretation and awareness of common pitfalls ensure accurate conclusions and actionable insights
- Practical applications span protocol development, investment research, and security monitoring, each requiring tailored analytical approaches
